Let’s discuss today about a way to debug your Executors & Flows using Linkerd service mesh.
What is a Service Mesh?
From Linkerd docs
A service mesh is a tool for adding observability, security, and reliability features to “cloud native” applications by transparently inserting this functionality at the platform layer rather than the application layer.
Few of the commonly used service meshes are Linkerd, Istio, Consul etc.
Why Linkerd?
- Significantly lighter than competitors.
- Basic request tracing with no additional config.
- Telemetry & monitoring exposing Golden metrics.
- The simplicity of its usage is mind-blowing. Just annotate the K8S Deployment, and you’re done.
How does Linkerd work?
While this majorly underestimates the magic Linkerd brings, here are the major components. Feel free to go through the architecture in official docs.
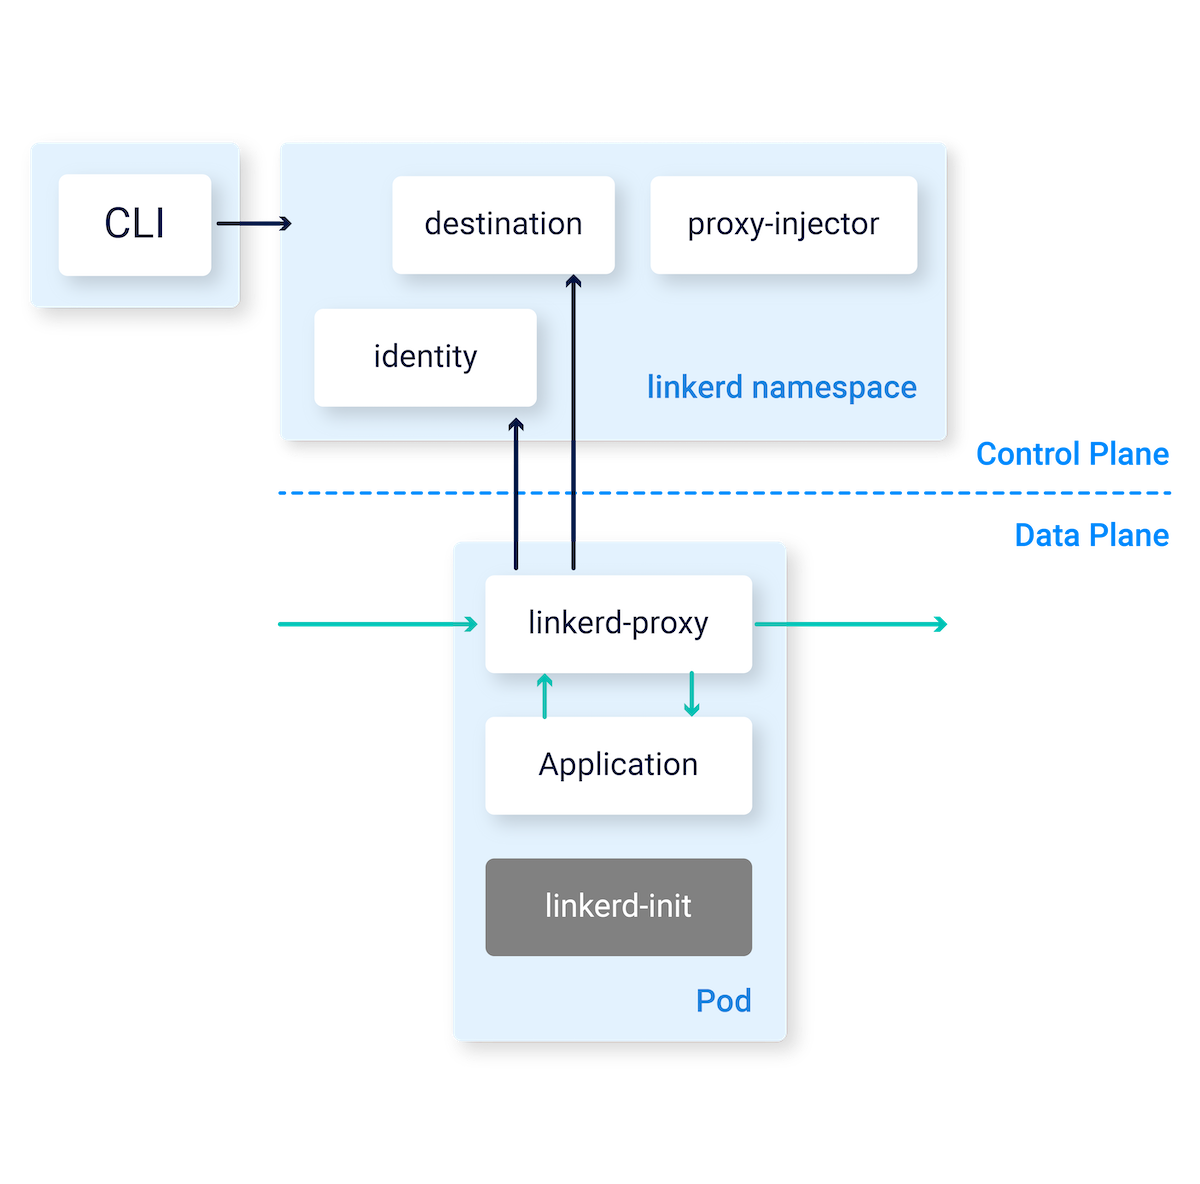
Data Plane
This sits next to your application (K8S Pod), hence called the data plane.
- linkerd-proxy: A sidecar container next to your Pod via which all traffic goes in & out.
- linkerd-init: An init container in the Pod to configure the iptables so traffic flows through the proxy.
Control Plane
This sits in a different namespace (linkerd by default).
- destination: Informs the linkerd-proxy about routing & TLS at destination.
- identity: Manages TLS certificates for proxy-to-proxy mutual TLS.
- proxy-injector: Adds the data-plane Pods to your Deployment.
Jina & Linkerd
Installation
Follow the official docs to install Linkerd CLI, Control plane & the dashboard on your cluster.
Annotations in Flow related K8S yamls
By default, when we export K8S yamls from a Flow, jina adds all linkerd annotations.
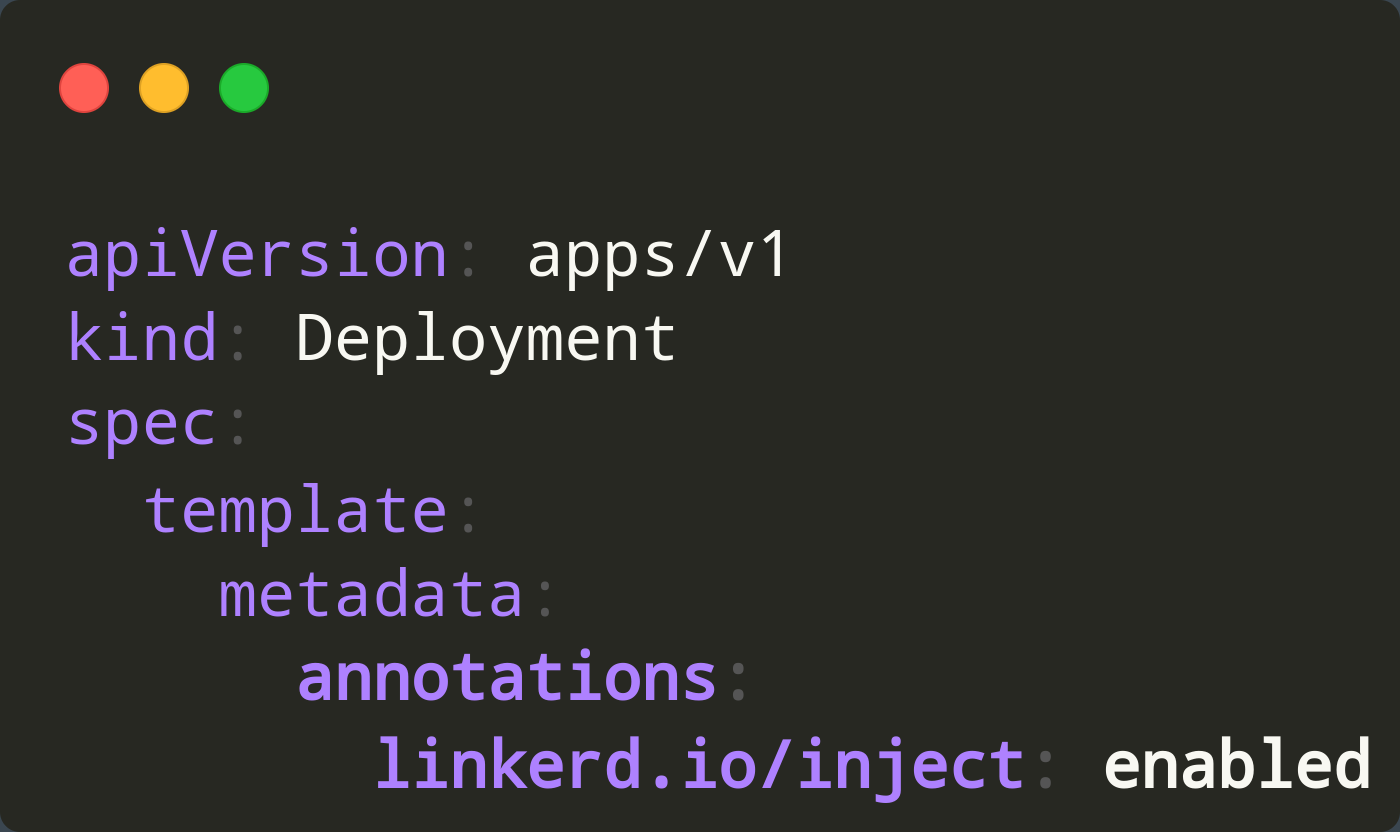
Applying the K8S yamls adds the linkerd-proxy container to your Pod (Note 2 containers per Pod)
$ kubectl apply -R -f flowdir/
$ kubectl get pods -n <namespace>
NAME                                       READY   STATUS    RESTARTS   AGE
embeddingsfilter-8598855df4-bp54j          2/2     Running   0          100m
gateway-8b45c579c-c9bcb                    2/2     Running   0          100m
pqliteindexer-58c7dc7986-jlnnz             2/2     Running   0          100m
transformertorchencoder-6d9875f575-jrx45   2/2     Running   0          100m
To tail the logs of the executor, you must pass the container name (executor).
$ kubectl logs gateway-8b45c579c-c9bcb -n <namespace> -f
error: a container name must be specified for pod gateway-8b45c579c-c9bcb, choose one of: [linkerd-proxy executor] or one of the init containers: [linkerd-init]

$ kubectl logs gateway-8b45c579c-c9bcb executor -n <namespace> -f
INFO:     127.0.0.1:35370 - "POST /post HTTP/1.1" 200 OK
INFO:     127.0.0.1:35372 - "POST /post HTTP/1.1" 200 OK
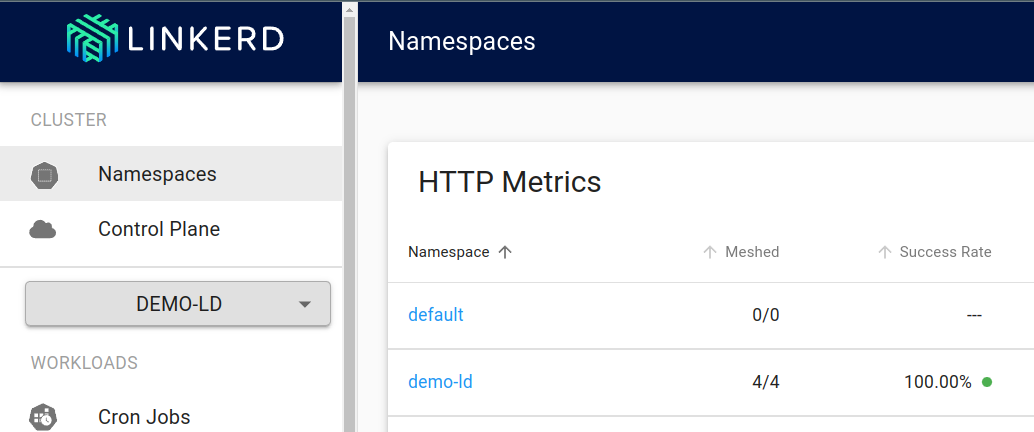
Explore the dashboard
linkerd viz dashboard &
Note the “Meshed” section for our namespace. All 4 Pods are meshed (include the “linkerd-proxy” container).
That’s it. It is that simple to integrate a service mesh & get the benefits such as mTLS, latency aware load-balancing, basic request tracing, easier retries & timeouts etc.
Let’s build & debug an application
Define & publish an Executor
For demo purpose, I created a “dummy” heavy Executor. Depending on the arguments passed, it’d sleep for some time or, add embeddings to the DocumentArray. This can be any of the heavy Executors in Hub.
import time

import numpy as np
from jina import DocumentArray, Executor, requests


class HeavyExecutorLinkerdDemo(Executor):
    def __init__(self, n_dim: int = 256, sleep: int = 3, *args, **kwargs):
        super().__init__(*args, **kwargs)
        self.n_dim = n_dim
        self.sleep = sleep

    @requests
    def foo(self, docs: DocumentArray, **kwargs):
        time.sleep(self.sleep)
        if self.n_dim != -1:
            docs.embeddings = np.random.random([len(docs), self.n_dim])
It is already pushed to Hub and can be used with jinahub://HeavyExecutorLinkerdDemo syntax.
Define & deploy the Flow
Now, let’s define a Flow with 2 Executors
- “slow_executor”: Sleeps for 1 sec per request
- “bulky_executor”: Adds a random embedding to each Document in the DA
jtype: Flow
executors:
  # A slow Executor
  # sleeps 1 secs per request
  - name: slow_executor
    uses: jinahub+docker://HeavyExecutorLinkerdDemo
    uses_with:
      n_dim: -1
      sleep: 1

  # A bulky Executor
  # Adds a 512 dim embedding to each Document in the DA
  - name: bulky_executor
    uses: jinahub+docker://HeavyExecutorLinkerdDemo
    uses_with:
      n_dim: 512
      sleep: 0
We can export K8S yamls from this Flow, apply them, wait for the Pods to start & expose the Gateway using “port-forward”.
$ jina export kubernetes flow.yml demo-linkerd --k8s-namespace demo-linkerd
$ kubectl create namespace demo-linkerd
$ kubectl apply -R -f demo-linkerd/
$ kubectl get pods -n demo-linkerd -w

NAME                             READY   STATUS            RESTARTS   AGE
fast-executor-5b5b68d449-l6nwf   0/2     PodInitializing   0          18s
gateway-c549bf99c-q2dpd          2/2     Running           0          18s
slow-executor-7c7bb75cfd-bx586   0/2     PodInitializing   0          18s
slow-executor-7c7bb75cfd-sc7h6   0/2     PodInitializing   0          18s
slow-executor-7c7bb75cfd-bx586   0/2     Running           0          20s
slow-executor-7c7bb75cfd-bx586   1/2     Running           0          20s
fast-executor-5b5b68d449-l6nwf   0/2     Running           0          22s
fast-executor-5b5b68d449-l6nwf   1/2     Running           0          22s
slow-executor-7c7bb75cfd-sc7h6   0/2     Running           0          25s
slow-executor-7c7bb75cfd-sc7h6   1/2     Running           0          25s
fast-executor-5b5b68d449-l6nwf   2/2     Running           0          30s
slow-executor-7c7bb75cfd-sc7h6   2/2     Running           0          30s
slow-executor-7c7bb75cfd-bx586   2/2     Running           0          30s

$ kubectl port-forward -n demo-linkerd pods/gateway-c549bf99c-q2dpd 8080:8080
Forwarding from 127.0.0.1:8080 -> 8080
Forwarding from [::1]:8080 -> 8080
Start sending requests to the Flow
Now that the Flow is ready to serve traffic, let’s build a toy DocumentArray of 100_000 Documents & start posting requests using jina.Client.
from datetime import datetime
from jina import Document, DocumentArray, Client

def on_done(r):
    print(f'{datetime.now()}, {r}')

da = DocumentArray(Document(text=f'text {i}') for i in range(100_000))
Client(host='grpc://localhost:8080').post(
    on='/',
    inputs=da,
    on_done=on_done,
)
# 2022-06-16 22:50:14.337450, <jina.types.request.data.DataRequest ('header', 'parameters', 'routes', 'data') at 139772554727376>
# 2022-06-16 22:50:15.340458, <jina.types.request.data.DataRequest ('header', 'parameters', 'routes', 'data') at 139772551648312>
# 2022-06-16 22:50:16.344768, <jina.types.request.data.DataRequest ('header', 'parameters', 'routes', 'data') at 139772554727376>
# 2022-06-16 22:50:17.355545, <jina.types.request.data.DataRequest ('header', 'parameters', 'routes', 'data') at 139772551648312>
# 2022-06-16 22:50:18.357875, <jina.types.request.data.DataRequest ('header', 'parameters', 'routes', 'data') at 139772554727376>
# ...
Exploring the Linkerd dashboard
We can see the how the deployments are connected.
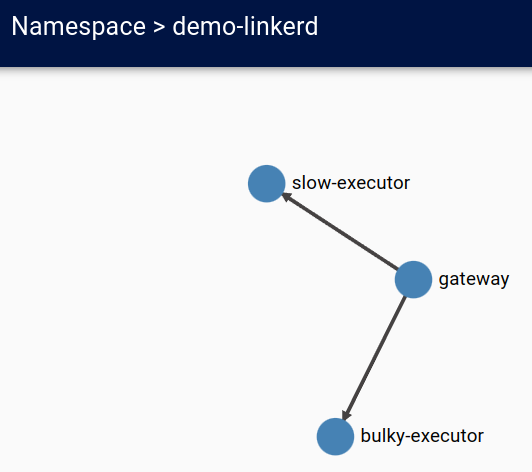
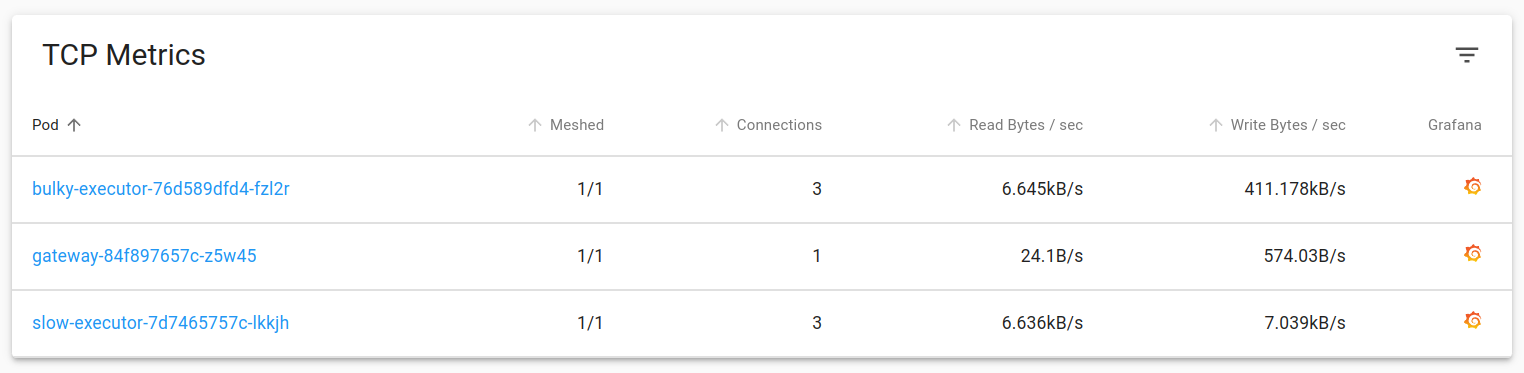
Latency & TCP metrics for each deployment are available in the same dashboard. As expected, “bulky-executor” is emitting responses at a much higher size compared to other Pods.
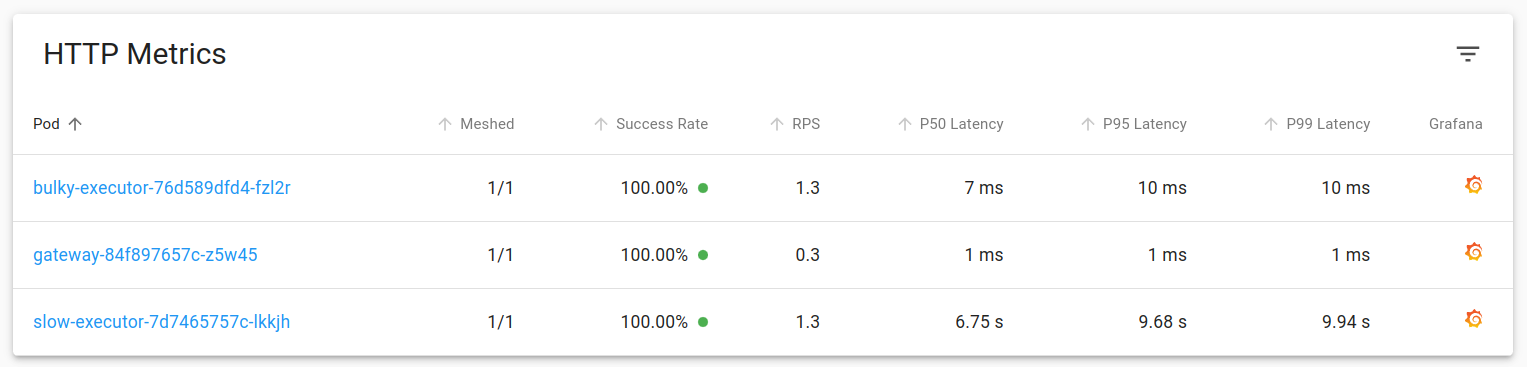
You’d notice something weird in the Grafana dashboard of slow-executor Pod. If you look at the latency, there’s a sudden burst and p50 latency has gone upto 50s.
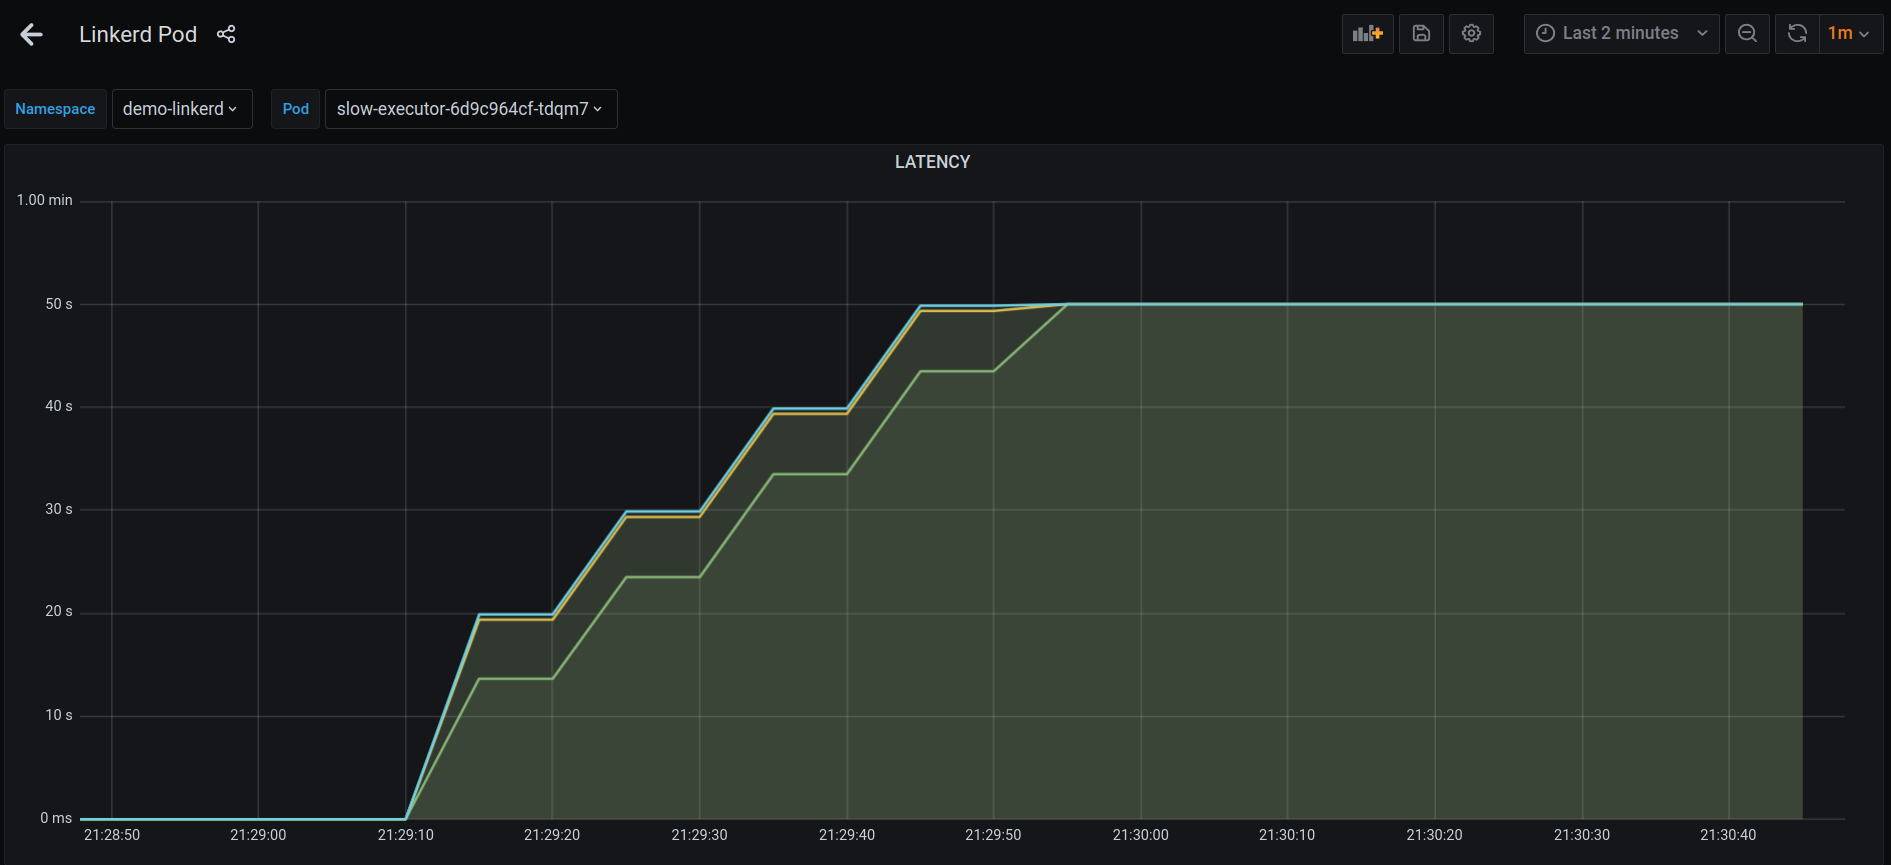
Though the responses on the Client side are still at the expected 1sec (the sleep time in slow-executor) interval.
# 2022-06-16 22:50:29.418764, <jina.types.request.data.DataRequest ('header', 'parameters', 'routes', 'data') at 139772551648312>
# 2022-06-16 22:50:30.420725, <jina.types.request.data.DataRequest ('header', 'parameters', 'routes', 'data') at 139772554727376>
# 2022-06-16 22:50:31.430988, <jina.types.request.data.DataRequest ('header', 'parameters', 'routes', 'data') at 139772551648312>
# 2022-06-16 22:50:32.436035, <jina.types.request.data.DataRequest ('header', 'parameters', 'routes', 'data') at 139772554727376>
What does it mean by having an average latency of 50secs then?
Let’s start another Python terminal & start sending requests via another Client.
from jina import Document, DocumentArray, Client

da = DocumentArray(Document(text=f'text {i}') for i in range(100))
Client(host='grpc://localhost:8080').post(
    on='/',
    inputs=da,
    on_done=print,
)
It doesn’t get any responses! Looks like, we are a victim of a DDoS attack 🤯
How do we solve it?
We have an argument called prefetch for exactly the same purpose. Here’s an example which limits to a maximum of 5 requests at a time at the Gateway, hence not overloading the “slow-executor`. Read more about the prefetch arg in Jina docs.
jtype: Flow
with:
  prefetch: 5
executors:
  - ...
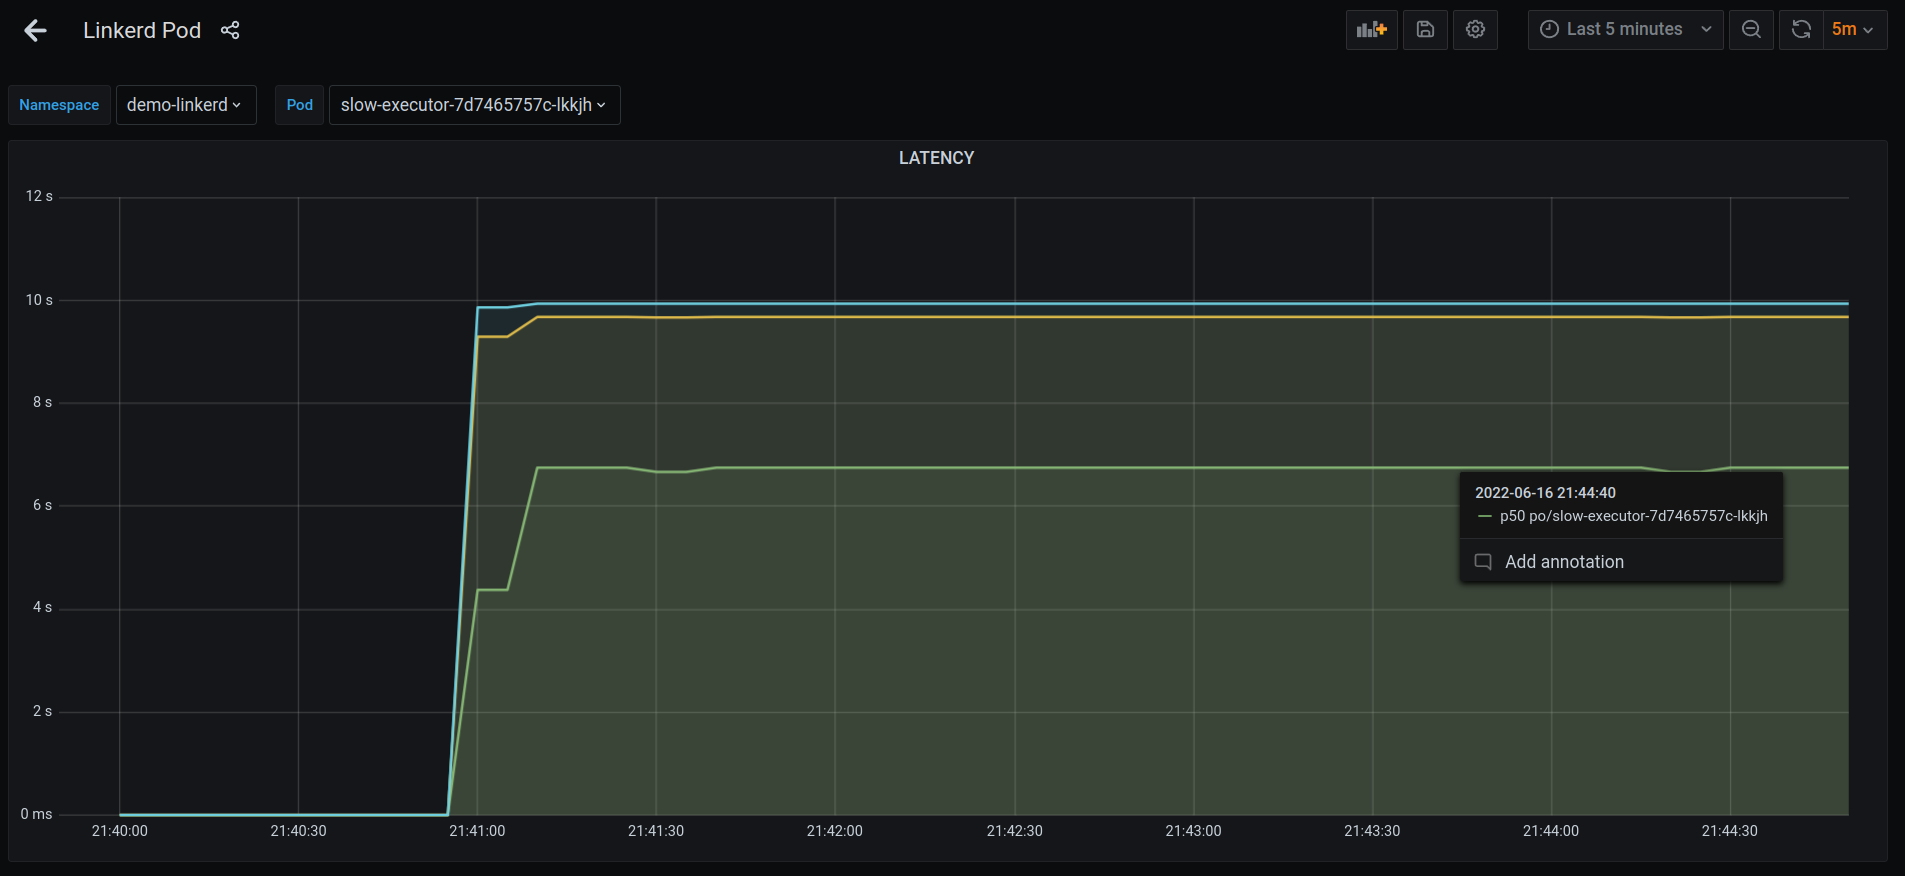
Alright. There’s a way to get around it. Let’s recreate the K8S yamls, redeploy everything, start posting requests again & check the dashboard.
p50 latency seems to be stable at 6s now, compared to the 50s before.
Let’s start sending requests via another Client again.
from jina import Document, DocumentArray, Client

da = DocumentArray(Document(text=f'text {i}') for i in range(100))
Client(host='grpc://localhost:8080').post(
    on='/',
    inputs=da,
    on_done=print,
)
# 2022-06-16 22:50:46.524090, <jina.types.request.data.DataRequest ('header', 'parameters', 'routes', 'data') at 140093958858176>
# 2022-06-16 22:50:47.527269, <jina.types.request.data.DataRequest ('header', 'parameters', 'routes', 'data') at 140093958858512>
# 2022-06-16 22:50:48.530814, <jina.types.request.data.DataRequest ('header', 'parameters', 'routes', 'data') at 140093958859744>
# 2022-06-16 22:50:49.536981, <jina.types.request.data.DataRequest ('header', 'parameters', 'routes', 'data') at 140093958858512>
Awesome! The Flow is no more a victim of one bad Client.
Gotchas?
- With 0 code changes in our Executors, Linkerd provided us a pretty nice way to trace requests in Jina. With this, we could debug & fix a DDoS attack by a malicious client.
- All communication between Gateway & Executors happen using gRPC. We didn’t have to configure anything, Linkerd takes care of proxying HTTP, HTTP/2, gRPC traffic smoothly.
- Linkerd provided latency-aware load balancing, which is a great feature in case we want to use more replicas with any Executor.
- Always use the right
prefetchwith your Flow!